An important distinctive feature of the technology is high availability of EtherCAT based solutions and systems. Availability implies two key factors: reliability of solution or system and reduction of downtime. Since reliability is mostly related to the technology itself and quality assurance, the greatest concern in reduction of downtime is to react to malfunction correctly and in proper time. For these purposes the diagnostic capabilities play a significant role. In order to utilize them to full extent and provide personnel with explanations and remedies of well-known cases KPA EtherCAT Studio has an alarm system with a troubleshooting guide.
Main Diagnostic Functions
- Data- and Frame- Logger
- Diagnostic Scanner
- Categorized Messages
- Causes & Remedies
- Connection Quality
Alarms List
Alarms List displays alarms, events, and emergencies that have been registered during the Studio being attached to master, in order of their appearance. Each message is provided with ID for better recognition, a time stamp to show when it happened, and a brief explanation of the problem or event. You can sort out the messages according to their severities and source.
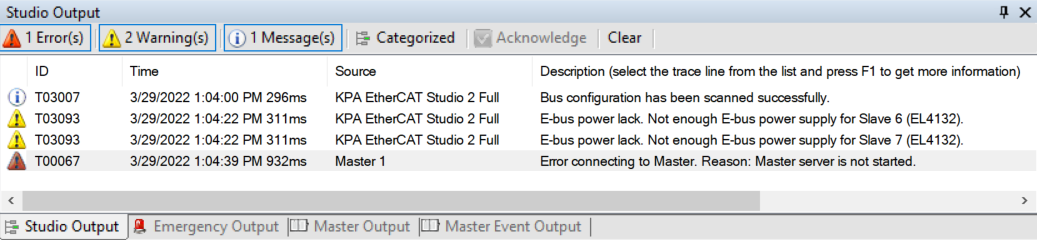
Faults and Emergency massages
Alarm system registers all alarms and events that may occur while the Studio is online (attached to master) and reports them in several ways. Severity of events stipulates the type of notification accordingly. Critical alarms are followed by a notification window in order not to miss such events and immediately take measures required to clear the problem. Descriptions of possible causes and remedies for the most common problems that may appear during commissioning or finding a bottle neck are presented in the Troubleshooting Guide – knowledge database collected by our commissioning and support team during the years of working with the technology. Descriptions are made in a comprehensive form and available online in context of event or problem that has emerged.

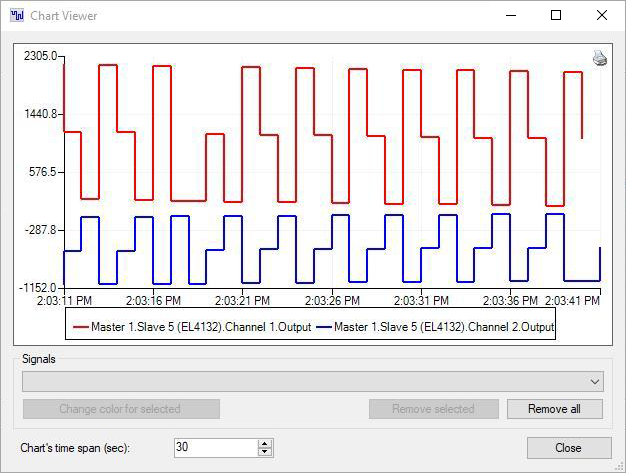
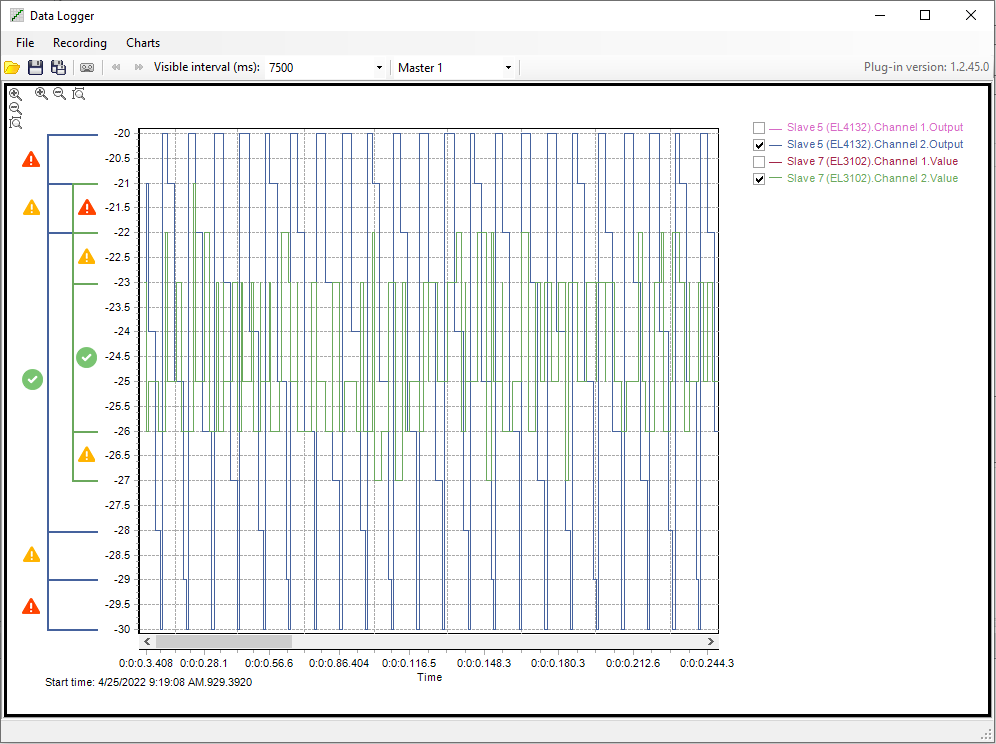
Online Chart Viewer
Online Chart Viewer is an important diagnostic function of KPA EtherCAT Studio. The Viewer allows to monitor multiple channels from one or several slaves simultaneously. It gets an opportunity to visualize the variables which are selected in the online mode.
Snapshot Viewer
The Snapshot Viewer window serves to display a chart created out of snapshots taken from a value (Channel or Signal). Taking snapshots is configurable. The user can define the following parameters:
- Total number of snapshots taken
- Time frame to take snapshots
- Repetition of snapshotting
- Time frame for repetition
Signal values are gathered during operation and stored to make a snapshot. The viewer then displays the snapshot. On the screenshot presented the monitoring of the signal’s value with the specified interval.
Taking snapshots reduces overall load on the system in order not to affect hard real-time performance.

Data Logging Tool
With the help of Data logger it is possible to set which variables are to be saved in the certain file. On the base of this file is generated the diagram. Data logger gives an opportunity to set the conditions (for example, to stop the recording or do something else when the set situation is happened). The logger runs and waits until the condition happen only after that the logger starts the recording and the record is visualized. So, the user immediately can see that the value out of tolerance.
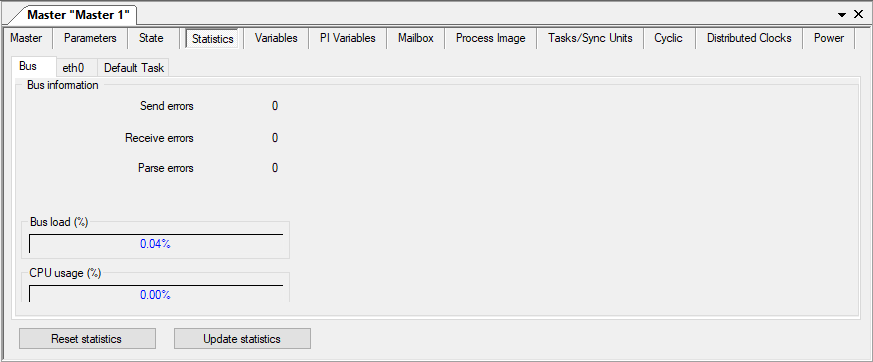
Statistics
The Studio collects various statistical data:
- Network activity acquired from the NIC
- EtherCAT activity acquired from the master
- CPU and bus loads
Ethernet (eth0 for Linux) statistics – statistics of the certain network card. It displays how many frames were sent, how many errors were fixed, how many packages were sent and received, etc.
Ethernet 2 it is NIC. Here is displayed how many frames the master sent and how many frames did not pass, etc.
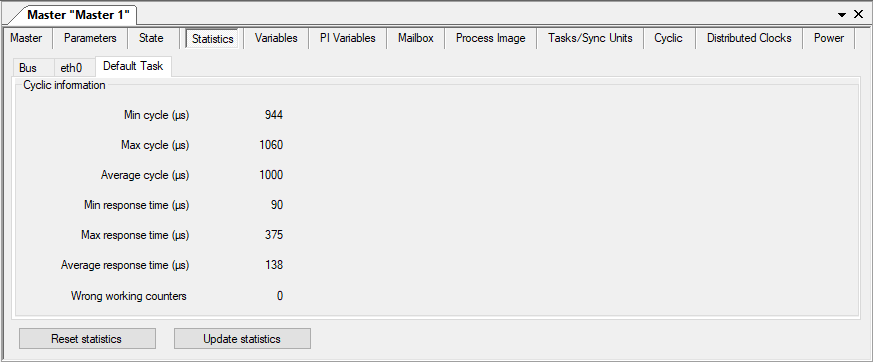
Default task statistics displays the divergence of the set periodicity values of the device with the real.
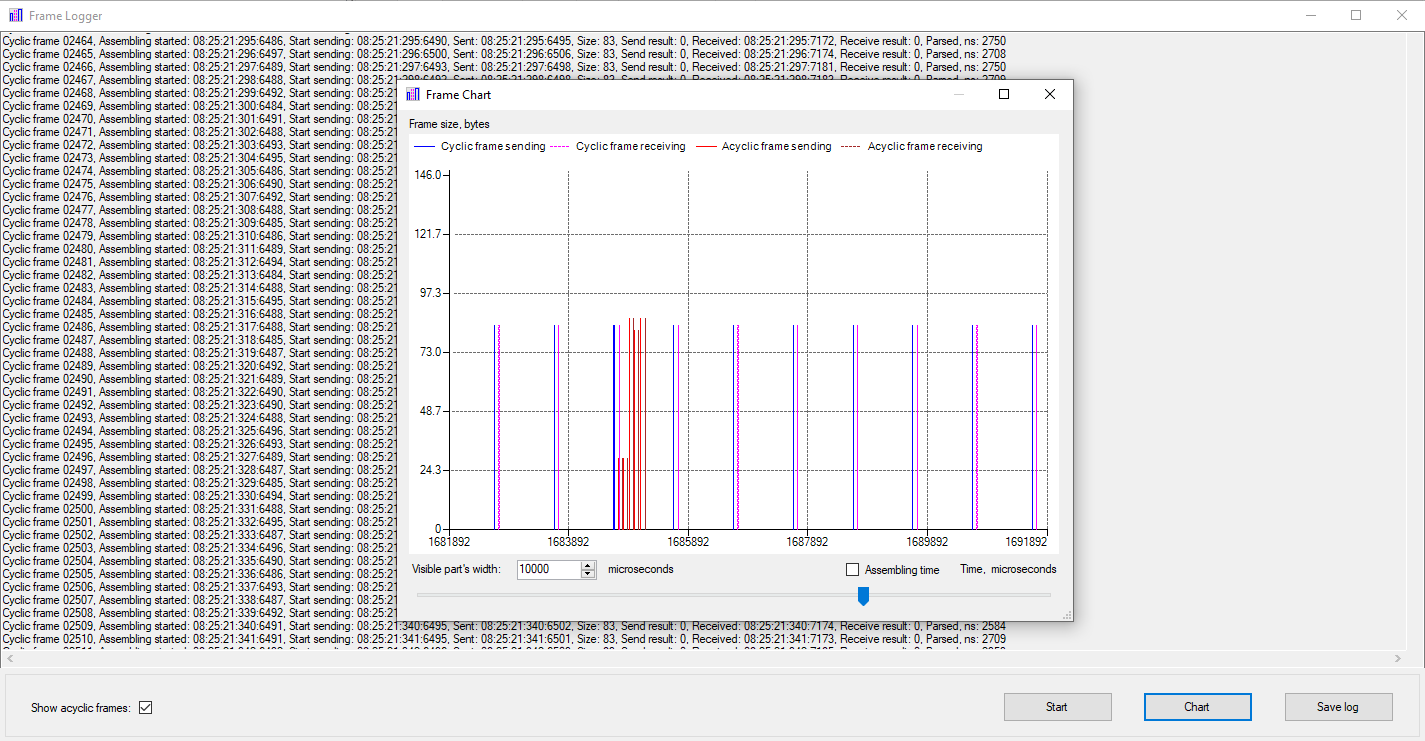
Log File and Frame Logger
Collected data are very helpful in analyzing performance of the entire system and finding bottle-necks if any occur. Frame logger viewer shows statistical information about all frames received and sent by Master and saved in a log file.
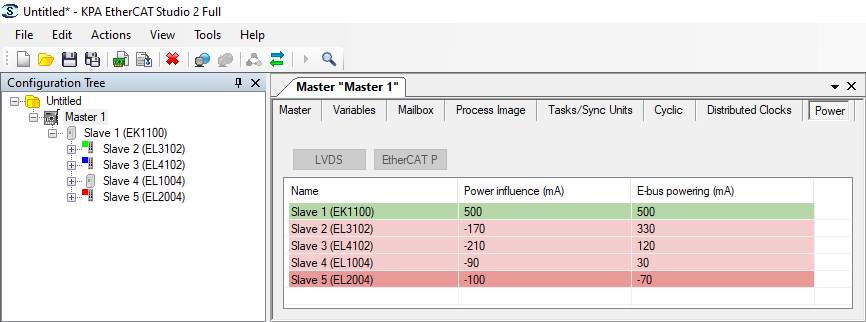
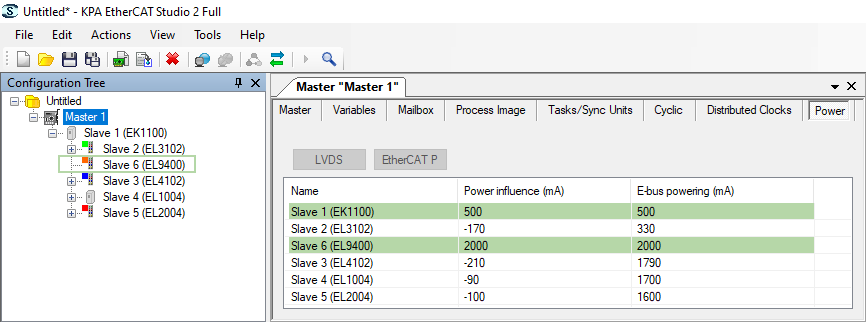
Power
The system of power tracing allows to monitor the power supply and consumption of LVDS slaves on the bus to avoid power lack issues in the configuration.
If the slaves are lack of power the tool discolors them to red and shows negative values of Power influence.
On the first screenshot it is seen power lack (red colored slaves) and on the second where added EL9400 (power supply terminal) there is enough power (all slaves are green).
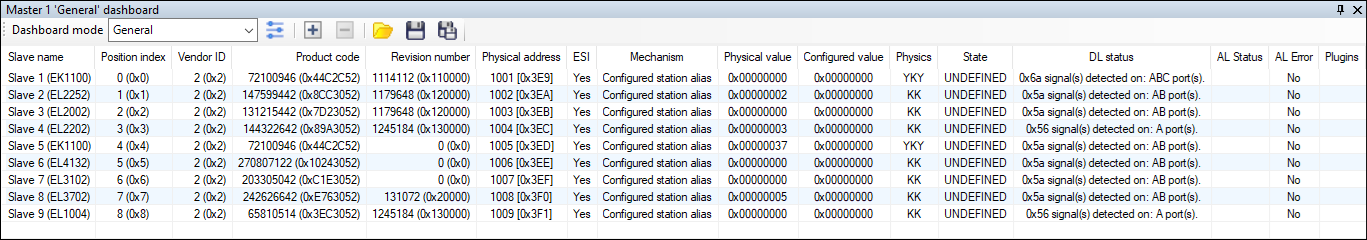
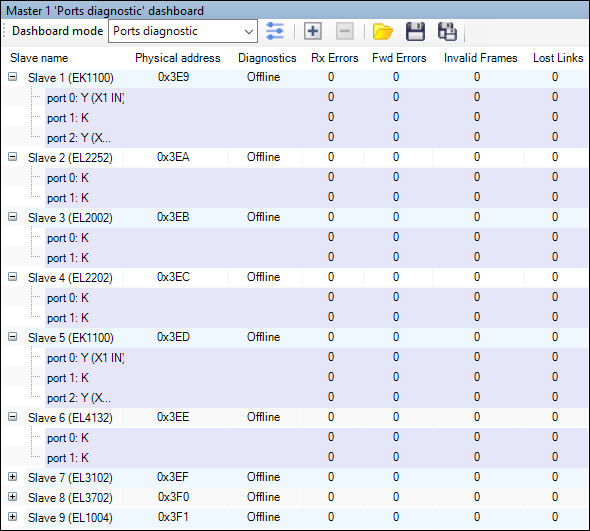
Dashboard
Dashboard is an important diagnostic function of KPA EtherCAT Studio. It allows to oversee bus slaves properties and bus ports parameters. Ports searching includes diagnostic that allows to detect errors in the ports in online mode.
Dashboard represented in two modes:
- General (slave properties) mode
- Ports diagnostic (ports parameters) mode