KPA EtherCAT Studio 2 supports all functionality of KPA EtherCAT Studio 1 and provides a set of new features that widen the abilities of the application, makes the work with it advanced, easier, and user oriented. In version 2 we revised architecture an do our best to avoid all limitations of previous version and improve the extend Studio functionality. Full description of Studio 2 advantages.
| Feature | Studio 1 | Studio 2 |
|---|---|---|
| Engineering units SCI files Import ENI |
— | 2.12.6109.0 |
| Dashboard Detailed progress dialogs Arrays elements Manual merge CAN interface plugin Bus configuration window Improved Slaves Library loading performance ESD CAN-EtherCAT device support Init command for Master |
— | 2.11.11700.00 |
| Slave library improvement Specifying retry count for init command |
— | 2.10.19600.00 |
| Connect button | 1.12.442.0 | 2.10.19600.00 |
| Slave Library search history improvement SCF overriding Cyclic exchange range Variables functionality improvement Hot connect improvement |
— | 2.10.16300.00 |
| uESI Oscilloscope Custom master/slave variables Getting list of Master parameters Diagnostics and Statistics based on Master 2.0 API Tasks / Sync units Tab Global search Dockable windows New automation interface (API) Windows Communication Foundation support |
— | 2.10.9200.00 |
| Slaves library search from the main menu | 1.12.426.0 | 2.10.9200.00 |
| Identification timeout for hot-connected slaves | 1.12.417.0 | 2.10.9200.00 |
Engineering units
In previous versions of KPA EtherCAT Studio to define the engineering unit in the signals users should set similar parameters for each signal. In KPA EtherCAT Studio new version users define the engineering unit only once and can select it from the list to apply to other signals.
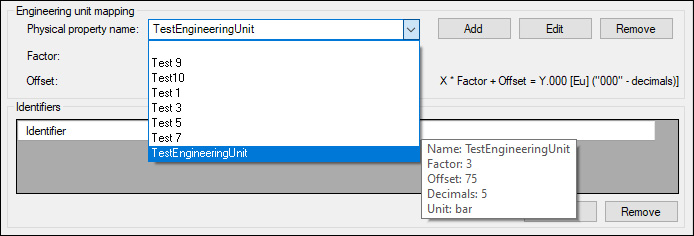
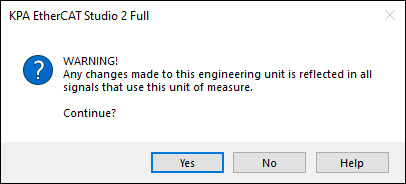
Users can add a new engineering unit, edit or remove the existing ones. In case of editing of existing engineering unit all the changes are reflected to all signals where this engineering unit is used and during the saving appears the corresponding message.
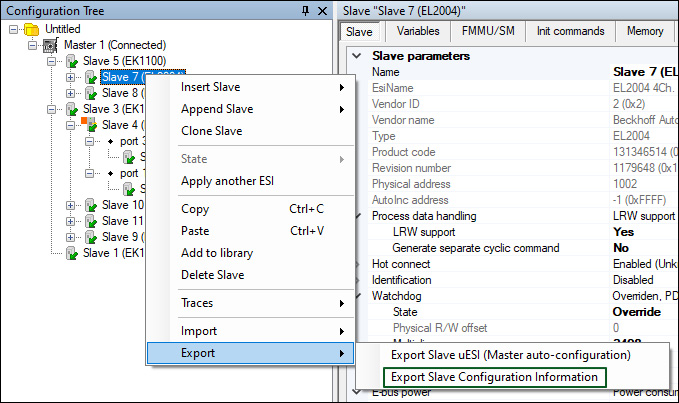
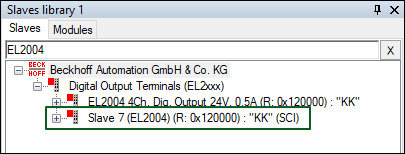
SCI files
The new version of KPA EtherCAT Studio allows to load to the Slave library not only ESI files but also SCI files.
SCI – Slave Configuration Information, contains a definite configuration for an EtherCAT Slave on the basis of the setting parameters of the device description file (ESI, EtherCAT Slave Information).
The user can save the set Slave configuration in the Slave library with the aid of SCI file and apply this configuration to other Slaves just selecting the file from the library.
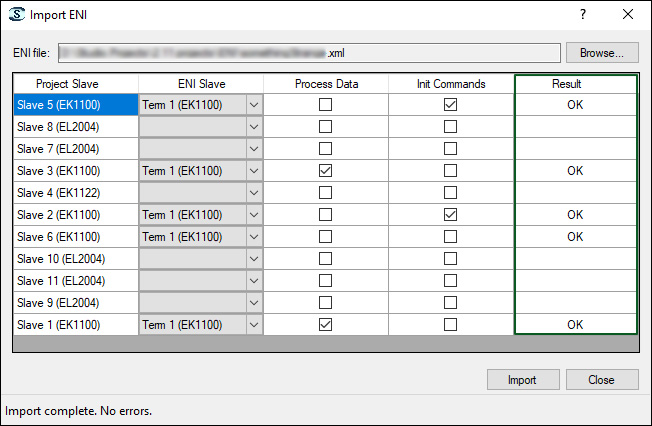
Import ENI
The new version of KPA EtherCAT Studio gives an opportunity to import configuration (process data and init commands) of a master from ENI file.
Dashboard
The new version of KPA EtherCAT Studio gives users the opportunity to view all bus slaves properties and ports parameters through an easily customizable table view – Dashboard.
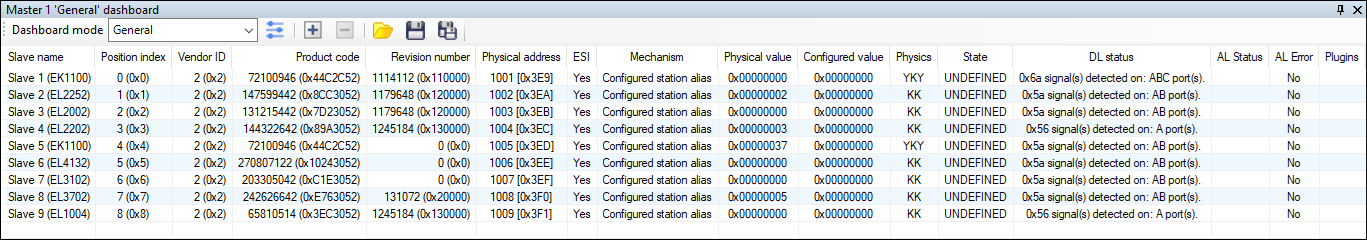
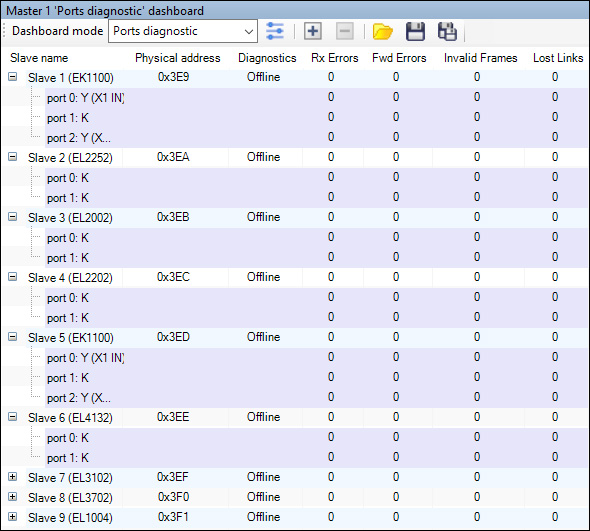
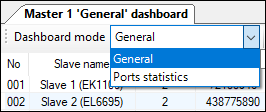
User can select General (slave properties) or Port statics (ports parameters) mode and adjust by themselves the columns to display.
In KPA EtherCAT Studio Premium it is possible to create new dashboard by clicking  .
.
There is an opportunity to load another settings from the folder by clicking  . As well, the user can save current settings to the XML file to use them in the future by clicking
  .
.
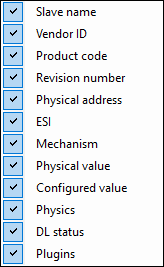
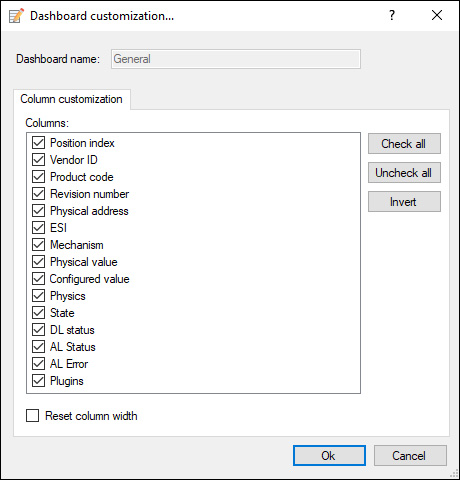
Besides, the user can select which column should be displayed in the dashboard window, right click any column name and fill corresponding check boxes.
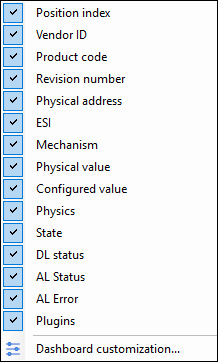
Dashboard customization is accessible in KPA EtherCAT Studio Premium by clicking  .
.
Detailed progress dialogs
To let user know about the status of loading, during the project opening and PDO loading appear progress bars.
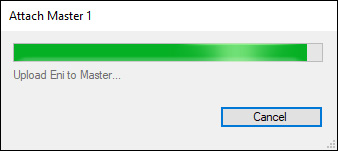
During scanning or attaching the Master, appears the progress dialog where user can oversee the progress or break up the scanning or connection.
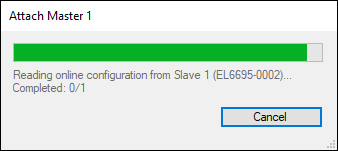
Additionally, added messages about reading OD via SDO while attaching.
Arrays elements
Arrays elements in configuration tree:
Version 2.11 provides the ability to observe array variables in the configuration tree. The user can see the type, length, and signals quantity there.
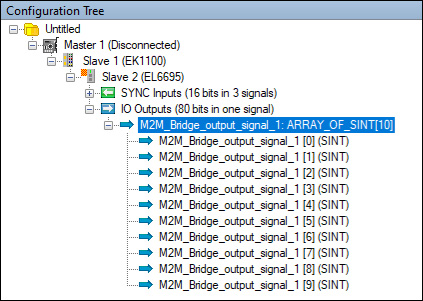
Additionally, the user can set default value for array elements.
M2M plugin:
The feature enables the automatic configuration for secondary device during M2M plugin activation and supports arrays for EL6692/EL6695 including arrays > 255 bits.
Manual merge
The window allows the user to add slaves to the resulting configuration manually. To replace all items in the manual configuration by the bus configuration items use the Replace All button. The items stands in the same order as on the bus. The Insert All New button allows to add to the current Studio configuration the items that are missed there. The items inserted to the places corresponding to their places on the bus.
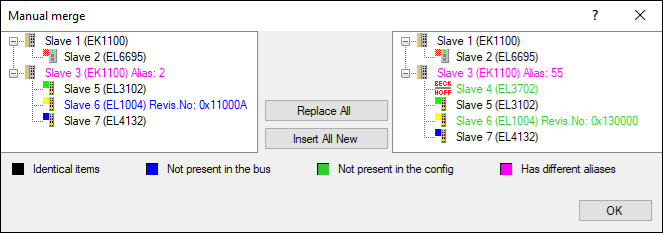
The current Studio configuration is displayed in the left pane while the bus configuration – in the right one. The colors of the slaves show the slaves status in the configurations.
CAN interface plugin
In KPA EtherCAT Studio 2.11 the ESD CAN-EtherCAT device is supported in the CAN interface plugin. This update allows to configure the ESD CAN-EtherCAT device to work with a CAN bus.
Bus configuration window
The Bus configuration window is accessible from the View menu and serves to show plain bus configuration.
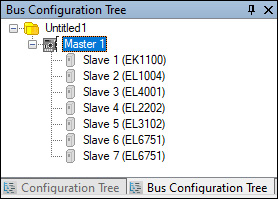
The window is useful to build the topology in case of error issues.
Improved Slaves Library loading performance
Implemented new function that allows to read ESI partially and load only those setting that are required. Thanks to that the process of Slaves Library loading became faster and the Salve Library takes up less space.
ESD CAN-EtherCAT device support
In new Studio version ESD CAN-EtherCAT device is supported in CAN interface plugin. This update allows to configure the ESD CAN-EtherCAT device to work with a CAN bus.
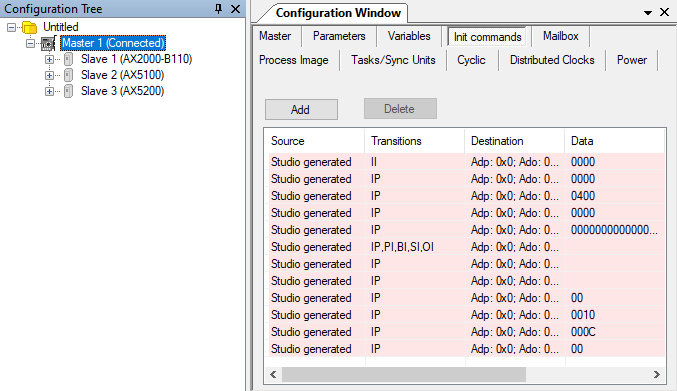
Init command for Master
In this version appears new tab – Init command for Master. This feature provides the possibility to add Init command to Master. The tab allows to apply commands which are common for all Slaves.
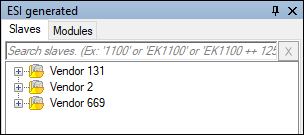
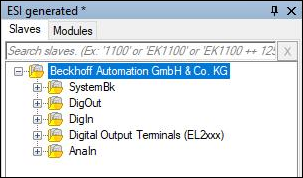
Slave library improvement
From now on, when scanning slaves for which there are no ESI files in the slave library, instead of Vendor(x) are displayed their names.
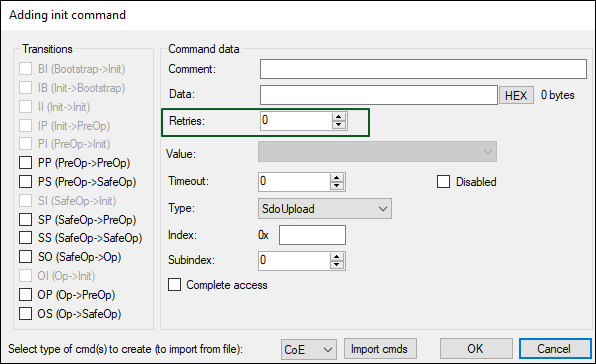
Specifying retry count for init command
To give a user an opportunity to specify the number of init command retries, a special field appears in the Adding init command dialog.
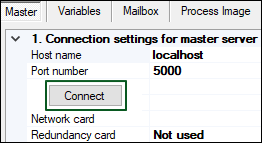
Connect button
In previous versions to connect to Master from the Master tab user should double-click the name of the host or after selecting the name press Enter. From now on to the previous two methods is added one more – the Connect button.
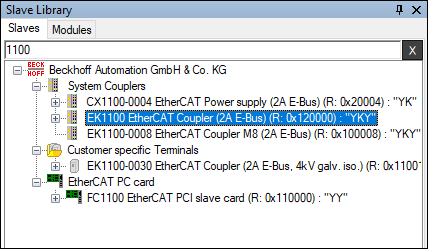
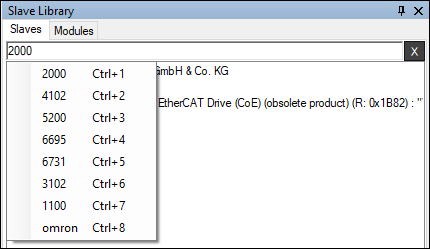
Slave Library search history improvement
To make work with Slave library more convenient, a possibility to search the Slave by its name or part of it was added. Also, a user can call up the history of searches by right-clicking in the search bar.
SCF overriding
From now on by customer request we can include the feature called SCF overriding (OEM licensing). The function is intended to customize feature set according to customer’s needs. It allows to sub-license our product as a part of the customer’s product and restrict suggested features. For example, customer can change product icon, name, and splash image.
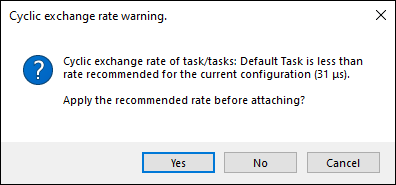
Cyclic exchange range
The task cycle time is based on default task cycle time (Master cycle time in case of single task). Each task cycle time is checked (if it greater than minimum possible cycle time) and warn user about too small cycle time to transfer selected amount of process data.
Variables functionality improvement
The functionality of virtual variables was upgraded and improved. A user can create virtual variables on the base of real slave or master variables, split them, and combine. Furthermore, user can create custom variables with user’s properties.
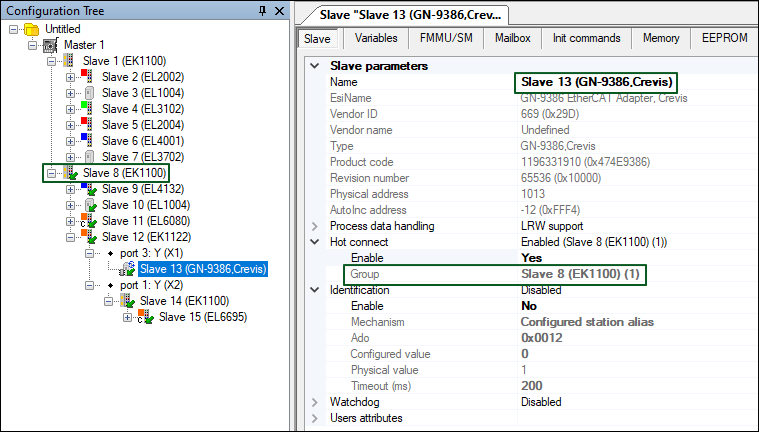
Hot connect improvement
Added a possibility to create not only hot-connected slaves or segments, but also hot-connected groups.
uESI
KPA EtherCAT Studio 2 gives an opportunity to create user’s slaves descriptions (uESI-s) based on ESI-s (EtherCAT Slave Information XML files) provided by vendors. uESI feature allows the user to edit slave’s description: rename the slave, change PDO-s configuration and other parameters, add uESI attributes etc.
A set of uESI-s is called Slaves Library collection. The user can load it from ESI-s and load/save it from/as KPA ESIs Storage (XML file) or MS SQL Storage. It is possible to edit the collection: export, remove and clone a separate uESI or import uESI-s/ESI-s from different sources.
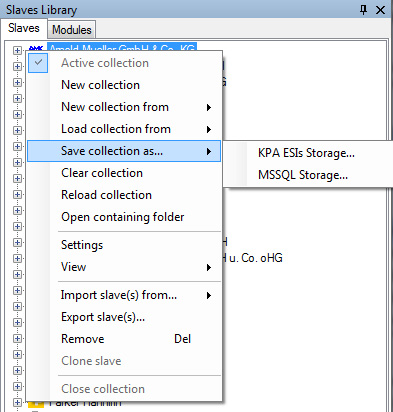
NOTE. In case of saving/loading uESI collection from MS SQL Storage, you need Microsoft® SQL Server® 2008 Express or higher installed on your PC.
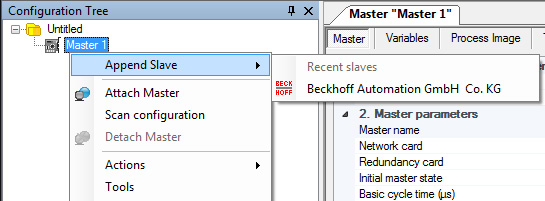
The user may create a few collections but only the active one is used while scanning the bus configuration and adding a slave to the Configuration Tree with the help of the shortcut menu.
uESI attributes
It is possible to add attributes to uESI-s collection, assign them to slaves and then use these attributes according to the user’s needs, for example:
- to build the collection tree,
- to find a uESI in the collection,
- to select a uESI while applying another ESI.
The steps of the collection tree building illustrate the use of uESI attributes:
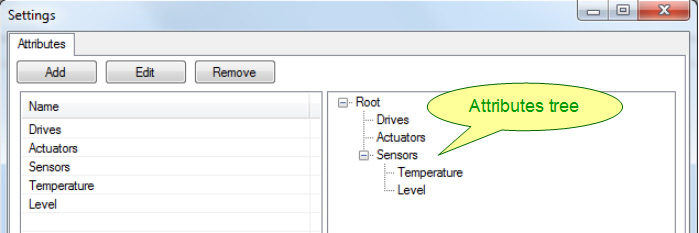
1. Add attributes for the uESI collection and create an attributes tree in collection’s Settings.
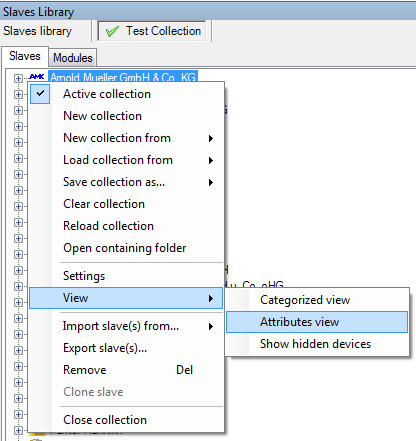
To access the Settings, click Settings on the shortcut menu for the collection.
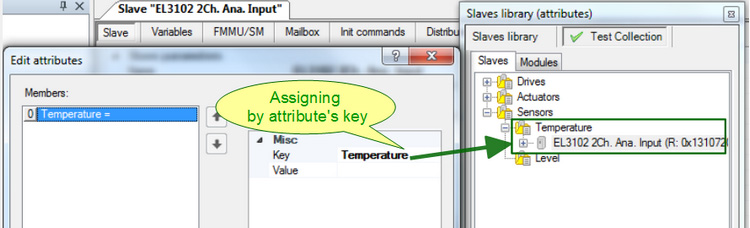
2. Assign attributes to the slaves by one of the ways:
- By specifying attribute’s key.
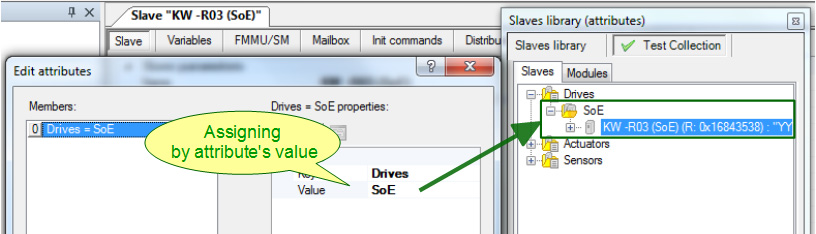
- By specifying attribute’s key and its value. The additional sub-folder named as attribute’s value will be created in the corresponding folder (named as the attribute’s key).
Such sub-folders have a particular icon  .
.
NOTE. It is possible to assign a few attributes to one slave.
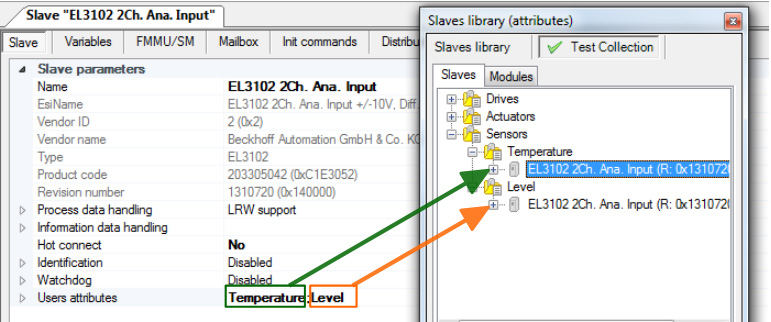
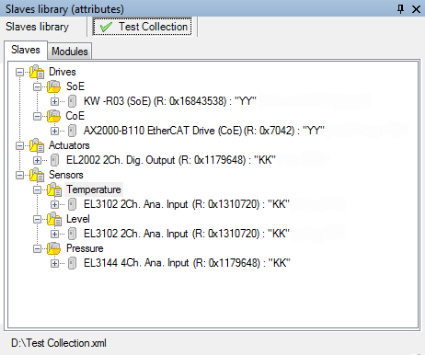
3. Apply attributes view. Click Attributes view on the shortcut menu.
As a result, the Studio 2 will build the collection tree according to the attributes tree and only the slaves with assigned attributes will be displayed.
Oscilloscope
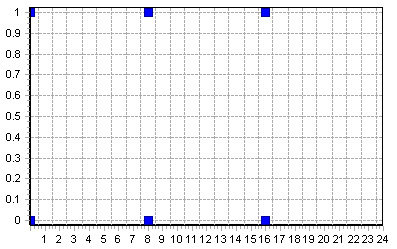
Run Time Data Logger handles the process of viewing data from the Master. This tool allows to observe signals variation in run-time mode. There is an opportunity to set the type of chart: Line, Multiple axes or F(x):
Depending on selected type, the signals view varies:
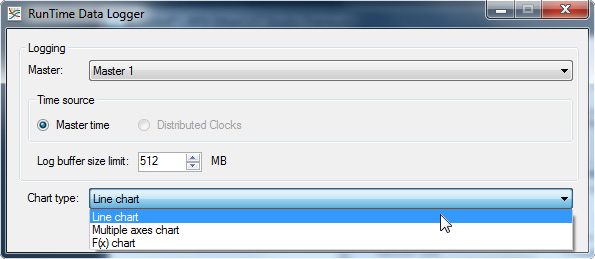
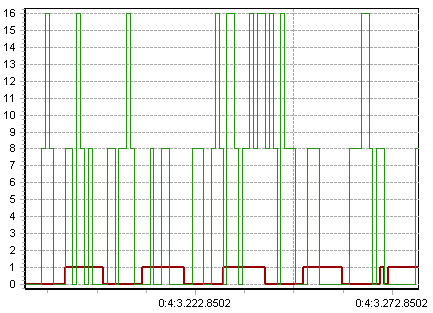
- Line chart – to display all signals in the same coordinate system. Vertical axis displays signals values, horizontal axis displays time values.
- Multiple axes chart – to display each signal in its own coordinate system. There are several vertical axes each representing values of one signal, and horizontal axis represents time values.
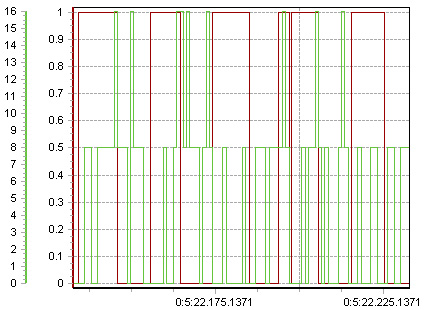
- F(x) chart – to display signals values as a scatter chart where each axis represents the values of a certain signal. For this type at least two signals must be selected for displaying. Then signals may be assigned to the axes.
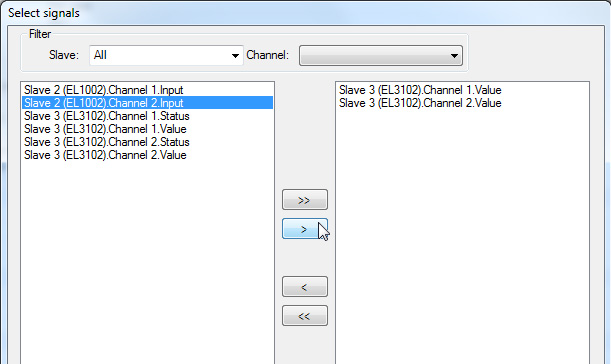
The set of displayed signals is selectable.
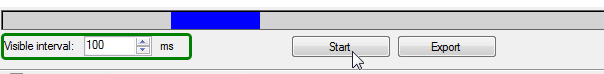
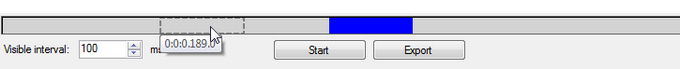
It is possible to set Viewing interval before logging begins.
After logging stops, logged data (changing signals) may be reviewed again. Just move on the time line.
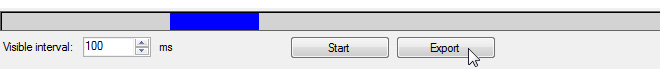
Also, the tool gives an opportunity to save logged data as *.emlog file by clicking on Export button.
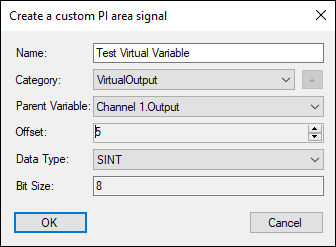
Custom master/slave variables
There is an opportunity in Studio 2 to create custom master or slave variables. All variables are displayed in master’s/slave’s Variables tab.

Using the buttons Add, Edit, Remove, it is possible to manage the list of variables.
There are several examples of these variables usage:
- For customer’s application needs.
- Master diagnostics. You may create a pre-defined Master variable (see Master documentation) and monitor changing its value to analyze behavior/state of the bus.
- For plug-in’s usage. Customer’s plug-in may store some data in these variables to be used for auxiliary calculation/processing.
To monitor the variable’s value changing you may use the Data Logger or Runtime Data Logger tools that allow to view a chart of the changing.
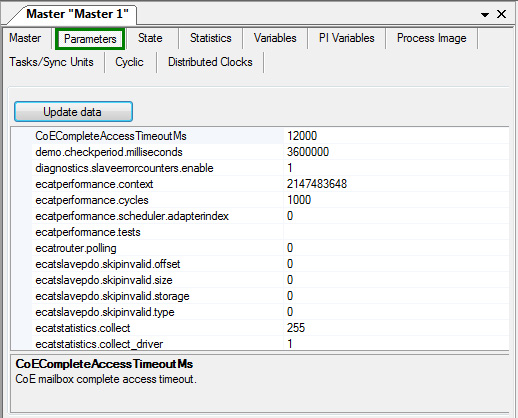
Getting list of Master parameters
Studio 2 allows to get a list of parameters from Master in online mode and view them on the Parameters Tab.
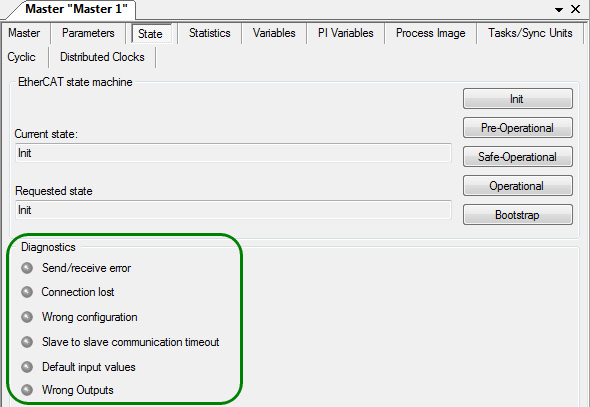
Diagnostics and Statistics based on Master 2.0 API
Diagnostics functionality (diagnostic data from Master and slaves) in Studio 2 has been implemented based on Master 2.0 Event Handler. Representation of Master’s diagnostic data (Master’s State Tab) has been updated as depicted below:
Statistics functionality in Studio 2 has been implemented based on Master 2.0 API. New statistics is displayed in Master’s Statistics Tab.
Updated Statistics Tab represents statistics separately (in different sub-tabs): from the bus, from main and redundant NICs that are used by Master (or only main NIC if redundant one is not used), for Default and user-created tasks.
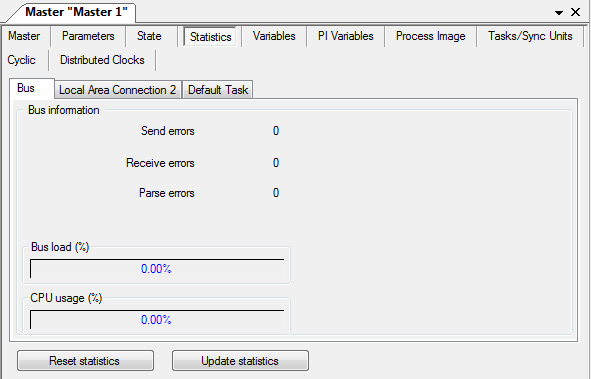
Updated Diagnostics and Statistics data are represented in Studio 2 while working with Master 2.0 or higher. In case of working with previous Master versions (for example v1.5) Studio represents the obtained data in the old style.
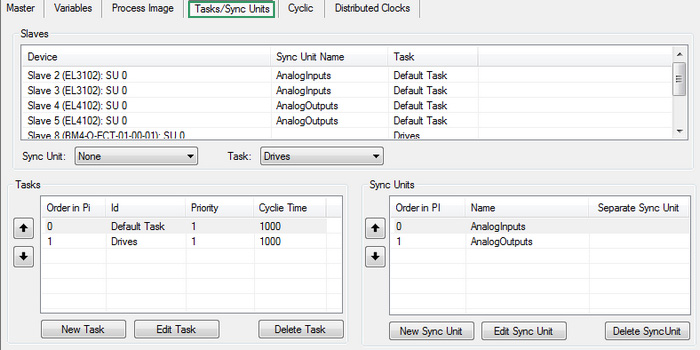
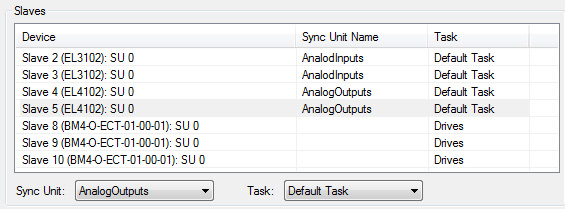
Tasks / Sync units Tab
Studio 2 provides an opportunity to configure PI data update by using tasks and sync units. The corresponding tab has been added and it allows to create tasks and sync units and assign them to slave’s sync units (set in ESI file). Using tasks and sync units gives an opportunity to updated particular blocks of Process image in certain time.
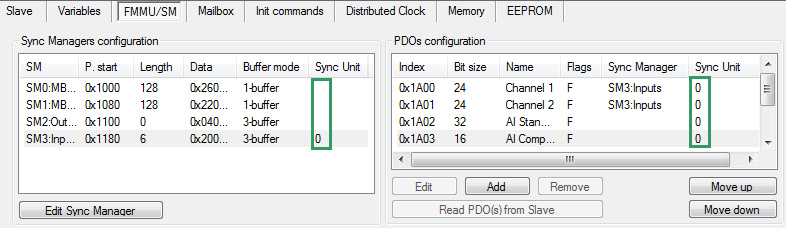
In Studio 2 slave’s sync units are displayed in the slave’s FMMU/SM tab:
In the Tasks/Sync Units tab there is a list of all available slaves’ sync units that may be used for PI configuring.
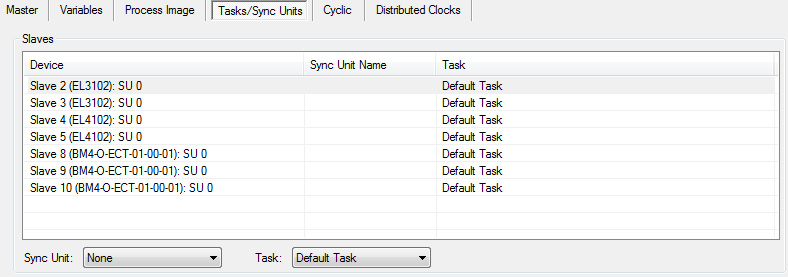
At the beginning all slaves’ sync units are assigned to Default Task. There is an opportunity in the Tasks/Sync units tab to create new tasks and sync units and assign them to slave’s sync units.
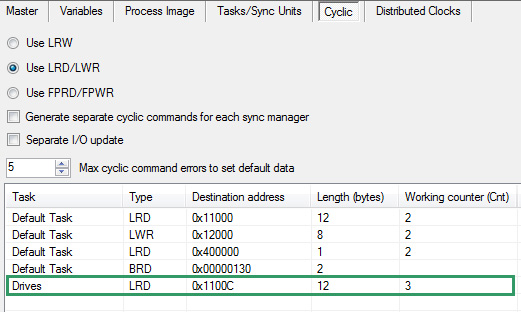
PI data assigned to a sync unit is updated by a separate cyclic command. PI data assigned to a task is updated by a separate frame. The corresponding cyclic commands will be displayed in the Cyclic tab:
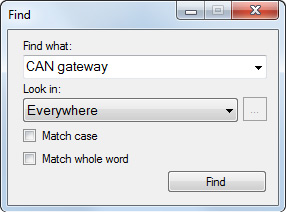
Global search
This feature provides a text search among the EtherCAT objects (e.g. slave name, PDO/PDO Entry name, Master/slave variables etc.). To set parameters of search and run it, click the Find button on the buttons toolbar.

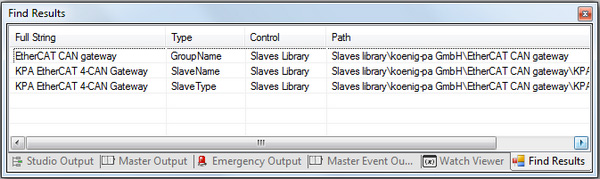
Result of search is shown in the separate window Find Results and allows viewing the result by double-click the item.
Dockable windows
In Studio 2 all parts of main window (Configuration tree pane, Configuration window, Slaves Library pane, Outputs window, Watch Viewer window) are dockable – may be docked to one of the sides of the main window or used as separate windows.
New automation interface (API)
In Studio 2 a new extended API based on EtherCAT Specification has been implemented.
Windows Communication Foundation support
Studio 2 supports Windows Communication Foundation (WCF) framework. From now on it is possible to access to Studio by using WCF.
Slaves library search from the main menu
From now on the command Find in slaves library is available in the main menu (Actions/Find in slaves library). Also, you can use a hot key combination Ctrl+F.
Identification timeout for hot-connected slaves
From now on it is possible to set a timeout of getting slave identification for hot-connected slaves.
During this time Master is waiting for a response upon the request for identification value of hot-connected slave.
It is possible to set the timeout to all hot-connected slaves in configuration (in Studio Options) as well as to certain hot-connected slave (on Slave Tab).