KPA EtherCAT Master (Master) includes diagnostic and statistical tools for examining EtherCAT traffic.
When more detailed information is needed to analyze EtherCAT traffic, the third-party analyzer Wireshark can be used. Wireshark is a free and open-source tool, making it one of the top packet analyzers available.
In order to set up connection between Master and Wireshark a switch can be used. But in case of a simple switch there will be a delay for getting a frame and then sending it, so such a system can’t guarantee precise timing. To avoid this delay and analyze real-time systems alongside Wireshark, a real-time sniffer like ET2000 from Beckhoff should be utilized.
Wireshark configuring and logging
To get traces from KPA EtherCAT Master on the target by using Wireshark remotely, do the following:
- Download and install Wireshark on the host PC.
Please note when choosing a version of Wireshark: if you intend to obtain performance metrics with it, we recommend using the version 1.12. This version better supports ESL protocol which is required when obtaining performance metrics. - Connect the target, the bus and the host PC with installed Wireshark through a switch / a sniffer (ET2000) as depicted below:
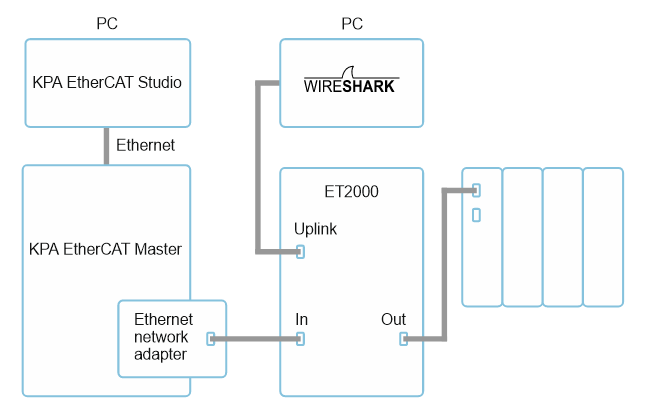
Figure 1. Example of Wireshark connection via ET2000 - On the host PC for the NIC connected to the sniffer, switch off all services. Pay attention that WinPCAP should be installed and corresponding service should be started.
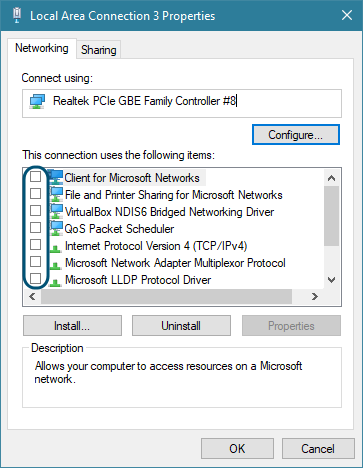
Figure 2. Properties of Ethernet nework adapter - Also, configure advanced NIC properties:
- Click Configure… and open Advanced tab
- Set properties as described below, where “m” – mandatory, “o” – optionally:
Property Value Status Flow Control Disabled m Gigabit Master Slave Mode Auto Detect o Interrupt Moderation Enabled m Interrupt Moderation Rate Off m IPv4 Checksum Offload Rx & Tx Enabled o Jumbo Packet 4088 Bytes m Large Send Offload V2 (IPv4) Enabled o Large Send Offload V2 (IPv6) Enabled o Locally Administered Address Not Present o Log Link State Event Disabled m Maximum Number of RSS Queues 2 Queues o Packet Priority & VLAN Packet Priority & VLAN Disabled m Receive Buffers 2048 (maximum) m Receive Side Scaling Disabled m Speed & Duplex Auto Negotiation o TCP Checksum Offload (IPv4) Rx & Tx Enabled o TCP Checksum Offload (IPv6) Rx & Tx Enabled o Transmit Buffers 512 o UDP Checksum Offload (IPv4) Rx & Tx Enabled o UDP Checksum Offload (IPv6) Rx & Tx Enabled o Wait for Link Auto Detect o
- Power management of the adapter:
- In the network adapter Properties window click Configure… and open Advanced tab
- Open Power Management tab
- Unset Allow the computer to turn off this device to save power
Autorecovery cycle data analysis
Each autorecovery cycle, the Master obtains diagnostic data from the bus.
By carefully setting up the system, it is possible to capture and analyze all necessary data, providing comprehensive insights into the bus’s functioning. To ensure successful collection of diagnostic data during every cycle, prepare the system:
- Launch Wireshark and run logging: on the toolbar click
 , select the NIC connected to the sniffer and click Close, then click
  to run logging.
 - Launch the Master and your application.
- After completion of the application work (or after completion of some specific operation), stop the logging by clicking
 and save the log file.
Now in the Wireshark log file it is possible to get the following data for analysis.
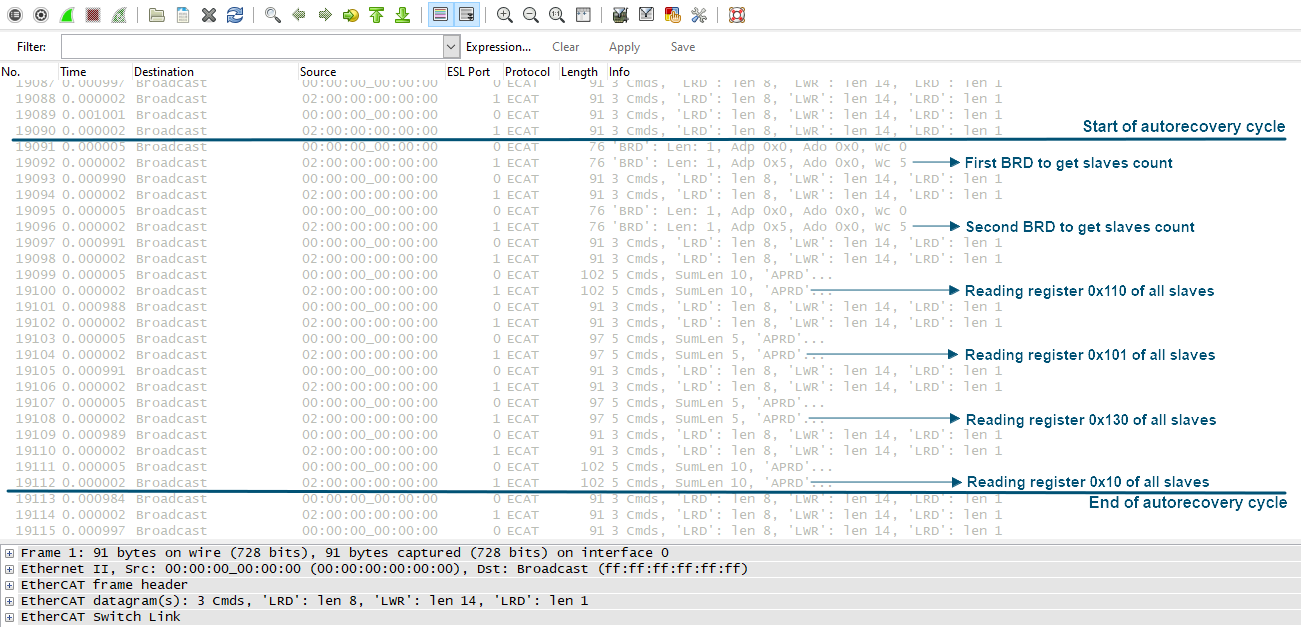
Figure 3. Example of getting autorecovery cycle data
Using a filter simplifies searching through the log file: type in an expression in Filter and then click Apply.
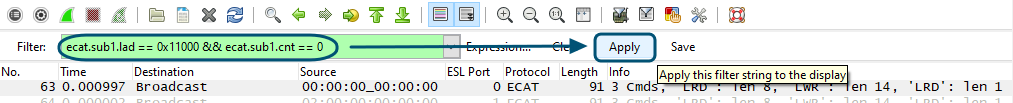
Figure 4. Example of applying the filter
Number of slaves in online on the bus
Each autorecovery cycle starts with sending Broadcast Read (BRD) command that is returned with working counter (WC) equal to number of online slaves on the bus. Filter the log by BRD commands.
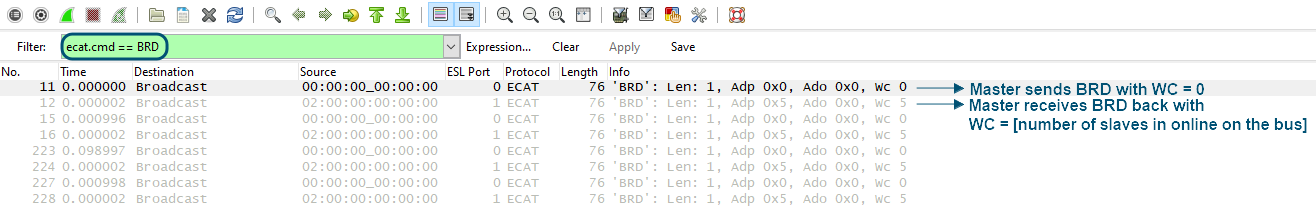
Figure 5. Example of getting slaves number
Requested state of slaves
To detect requested state of slaves, register 0x120 is read. The following values are possible:
01 – Init
02 – Pre-Operational
03 – Request Bootstrap
04 – Safe-Operational
08 – Operational
Filter the log file by sent commands with a value of register 0x120 and check the section “EtherCAT datagramms” for details.
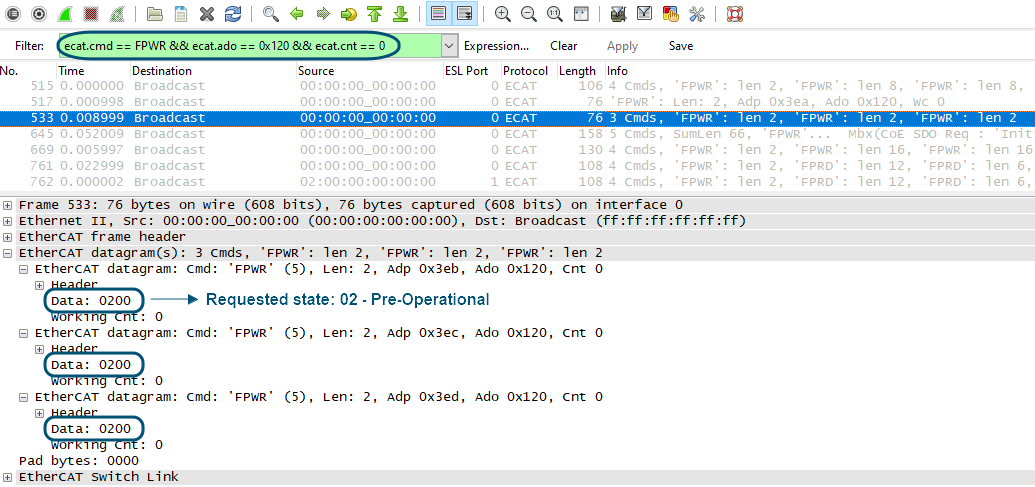
Figure 6. Example of requested Pre-Operational state of slaves
Actual state of slaves
To obtain the actual state of slaves, register 0x130 is read, the following values are possible:
01 – Init
02 – Pre-Operational
03 – Request Bootstrap
04 – Safe-Operational
08 – Operational
Filter the log file by received commands with a value of register 0x130 and check the section “EtherCAT datagramms” for details.
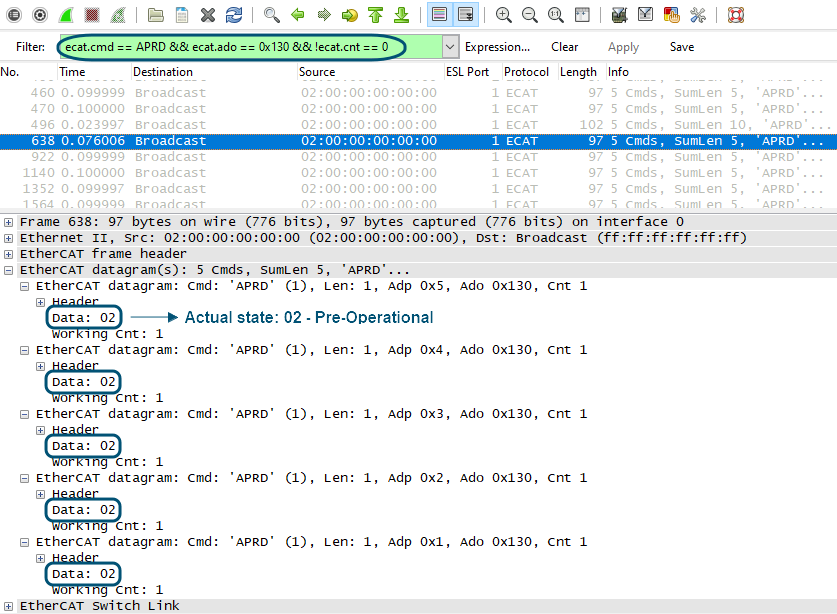
Figure 7. Example of actual slave state
Transition state error
When in fourth bit of register 0x130, the value 1 occurs it means some transition error. For more details check the value of register 0x134 (AL status code).
Lost or corrupted frame
Before detecting lost or corrupted frames, enable ESL protocol and configure Time Display Format in Wireshark, and then connect to Master in Operational state:
- Go to Edit > Preferences
- Expand Protocols and find ESL
- Set Enable dissector and then click OK
- In the main menu select View > Time Display Format and set:
- Seconds Since Previous Displayed Packet
- Microseconds
- Launch the Master and your application and switch to Operational state
- After Master switched to Operational state run loging:
- On the toolbar click and select the NIC connected to the sniffer, then click Close.
- Click to run logging.
- On the toolbar click
- In some time stop the logging by clicking and save the log file.
Normaly Master sends a frame with working counter equal to 0 and then receives this frame back with working counter not equal to 0, meaning that the frame was sent, went through the bus and returned to Master.
If in some moment in the Wireshark log file only the sent frame is detected but no received frame, it means that the frame is lost. somehow, in the Wireshark log send-receive pare will be detected but with CRC or alignment error, which can be shown in the log if ESL protocol is enabled as for performance metrics (see further).
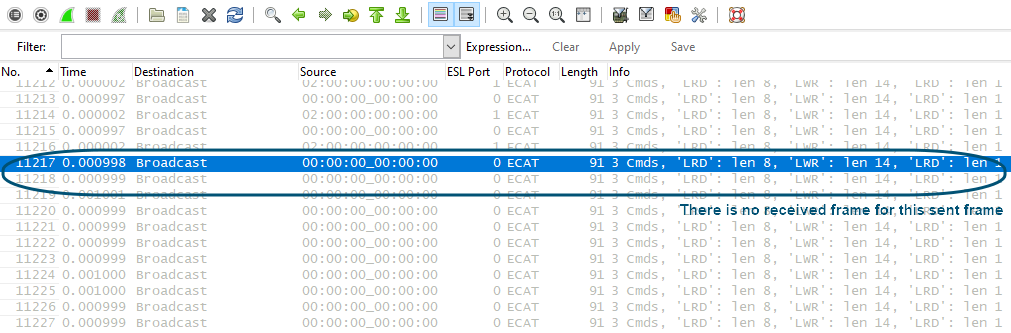
Figure 8. Example of detecting a lost frame
When a frame went through the bus but was corrupted somehow, in the Wireshark log sent-received pare will be detected but with CRC or alignment error.
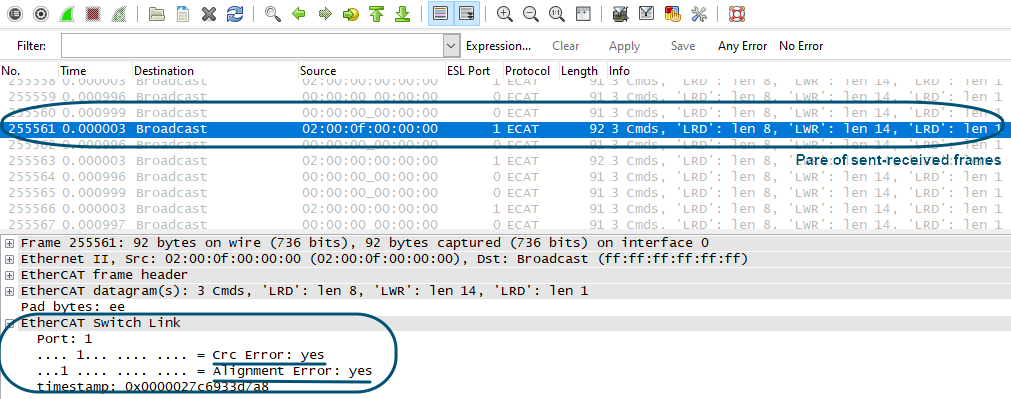
Figure 9. Example of detecting a corrupted frame
Performance metrics
Obtaing performance metrics in Wireshark requires the ESL protocol to be enabled, Time Display Format configured and set connection to Master in Operational state, as when preparing system to detect lost or corrupted frame
Master cycle jitter
Filter the log file by cyclic frames sent by Master
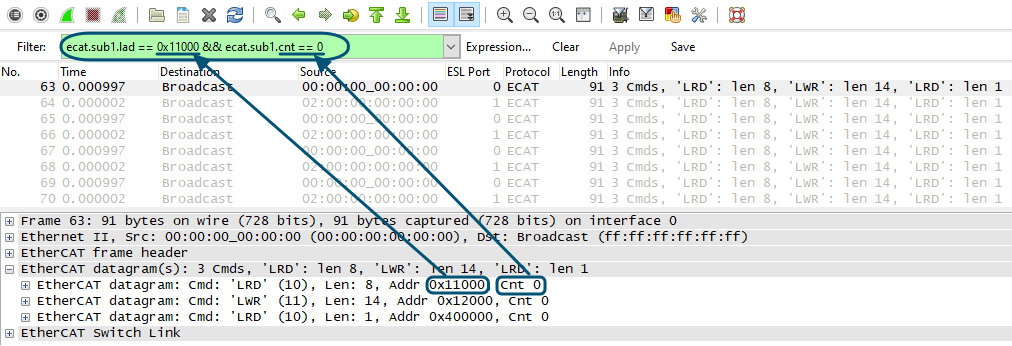
Figure 10. Example of filtering the log for sent frames
Sort the log by the Time column and find minimum and maximum values.
The difference between these values is the jitter. Note that the jitter should be +/-10% of Master cycle.
