
Capture and understand what happens on your EtherCAT network.
KPA EtherCAT Analyzer is a diagnostic and monitoring tool that captures, decodes, and visualizes EtherCAT communication. Connect Analyzer and turn raw traffic into clear, diagnostic insight – without touching your system configuration.
Windows support
Modular architecture based on Avalonia UI
Non-intrusive
No configuration changes
Why you need it
The problems it solves
EtherCAT networks are fast, deterministic, and opaque when something goes wrong.
The Analyzer makes the invisible visible – from sporadic communication faults to abnormal process-value behavior.
01
Sporadic communication faults
Rare errors that are difficult to reproduce. The Analyzer captures triggered snapshots around the exact moment a signal crosses a threshold, retaining only the relevant traffic.
02
Insufficient Master diagnostics
Standard Master tools provide limited visibility into protocol-level events. The Analyzer independently decodes EtherCAT frames, including datagram WKC values, timing information and process data. Direct integration with KPA EtherCAT Master adds Master-side diagnostic statistics, port status, error counters and slave status information.
03
Long and costly troubleshooting
Without the right data, debugging EtherCAT issues takes days. Frame-level inspection, real-time process data charts, and offline .pcap analysis reduce the time required to investigate and narrow down the root cause.
04
Unattended monitoring of production systems
Leave the Analyzer running with triggers; it captures only the moments that matter and retains the relevant snapshot for later offline analysis.
What it is
A standalone tool for independent EtherCAT frame decoding
The Analyzer decodes EtherCAT traffic independently of the Master implementation.
01
Decodes traffic itself – not via the Master
Built on the Generic Protocol Parser, it interprets EtherCAT frames independently. It never depends on a specific Master implementation, so it can analyze traffic generated by different EtherCAT Master implementations.
02
Connect, capture, analyze – without changing the Master or slave configuration
No changes to the EtherCAT Master configuration or slave application software are required. Connect the data source and the Analyzer maps raw frames to your Process Image variables using the corresponding ENI file.
Connection methods
Three ways to connect to a data source
01
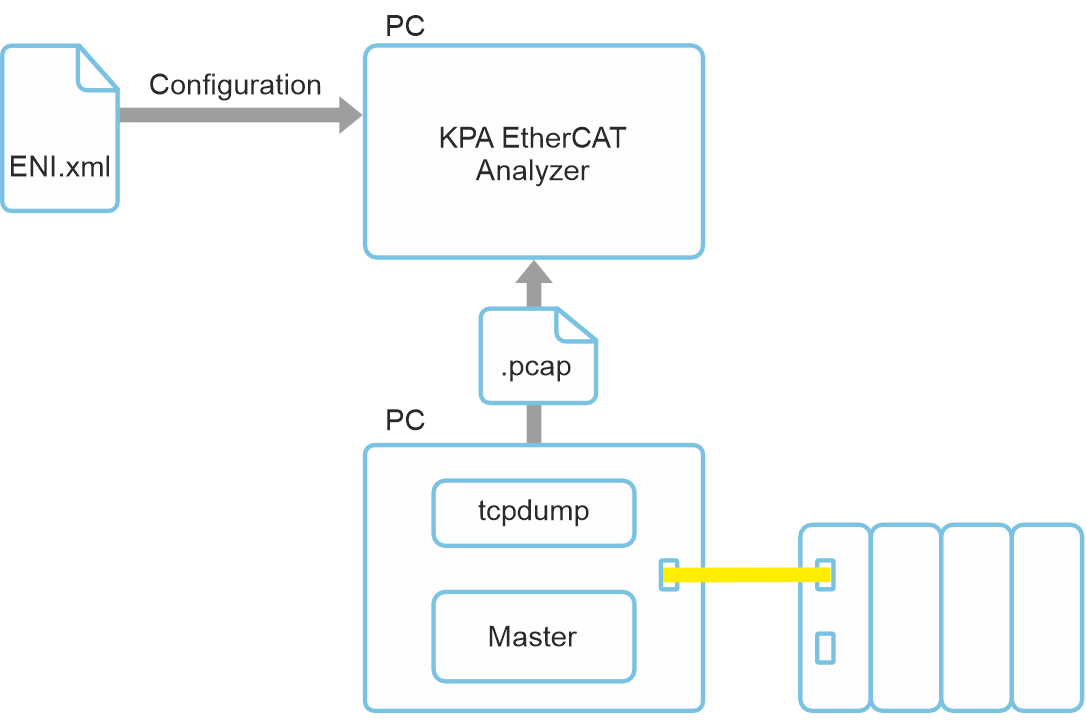
Open a capture file
Import .pcap capture files created with supported third-party capture tools. Analyze the traffic offline without a connection to the running EtherCAT network.
02
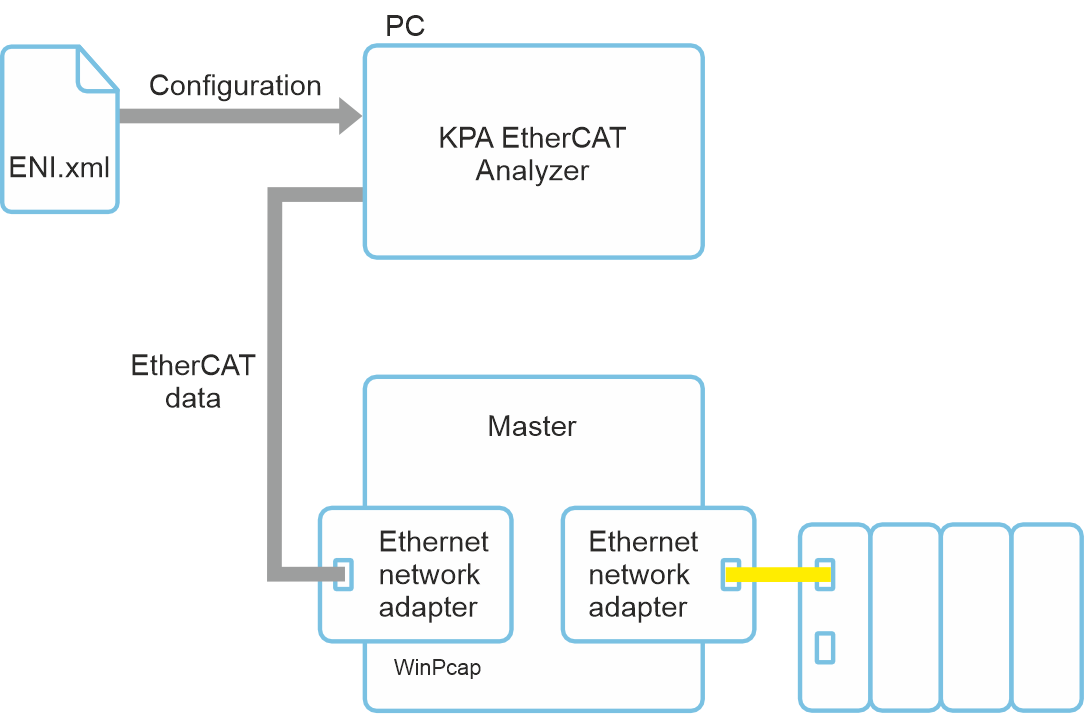
Connect to a live traffic source
Capture live EtherCAT traffic through a supported capture setup using compatible network interfaces. This mode is independent of the EtherCAT Master implementation. You just need an additional network adapter and WinPcap installed.
03
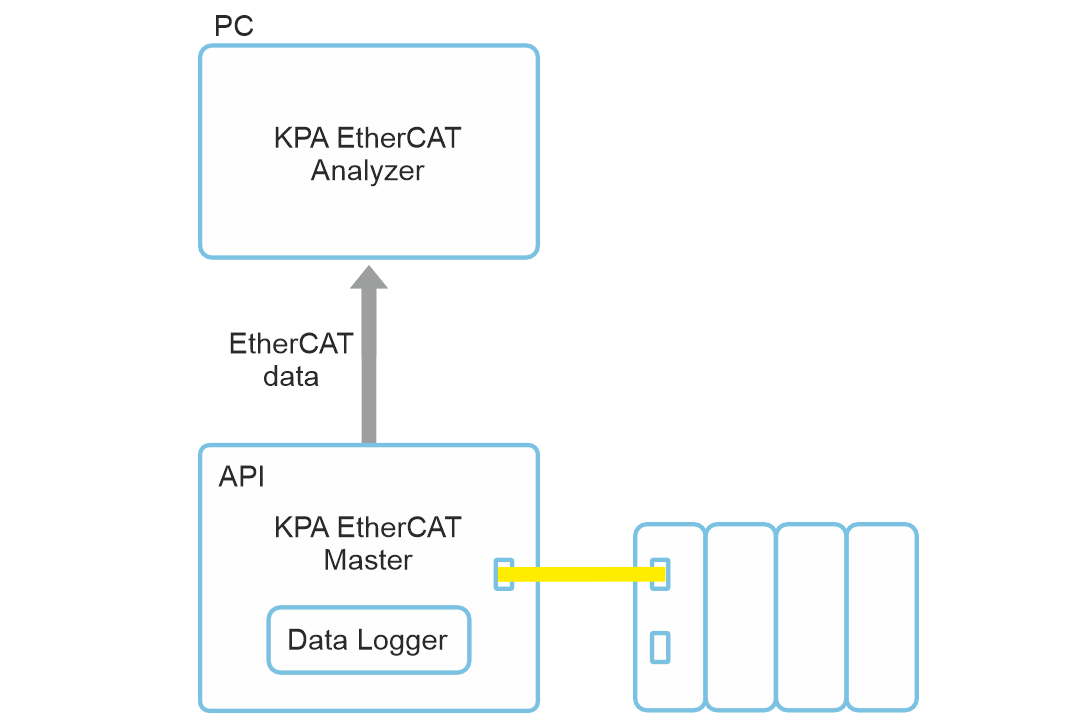
Connect directly to KPA EtherCAT Master
Obtain EtherCAT traffic and configuration data directly from KPA EtherCAT Master through the integrated interface.
Key features
EtherCAT Network Information file support
- Built on the standard EtherCAT Network Information (ENI) file
- Supports ENI files conforming to the ETG.2100 specification
- Includes the full Process Image definition – variables, data types, cyclic frame structure
- Works with ENI files generated by any compliant configuration tool – for example, KPA EtherCAT Studio 2
Direct KPA EtherCAT Master connection: the ENI data is obtained automatically from
KPA EtherCAT Master via the integrated API. No separate ENI file import is required.
EtherCAT frame decoding and timing analysis
- Decodes captured EtherCAT frames (.pcap)
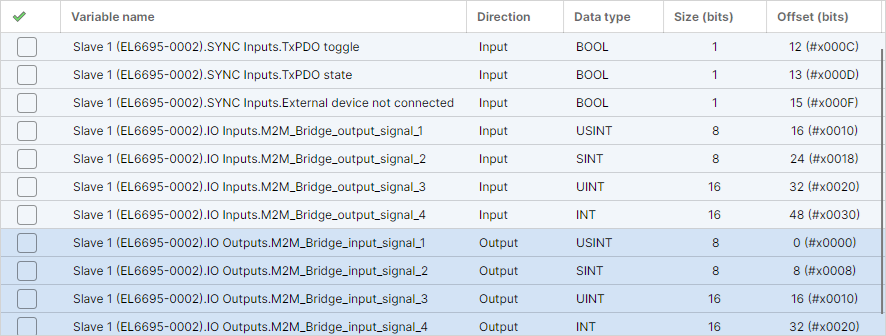
- Maps frames to Process Image variables defined in the ENI file
- No changes to the EtherCAT Master configuration or slave application software are required.
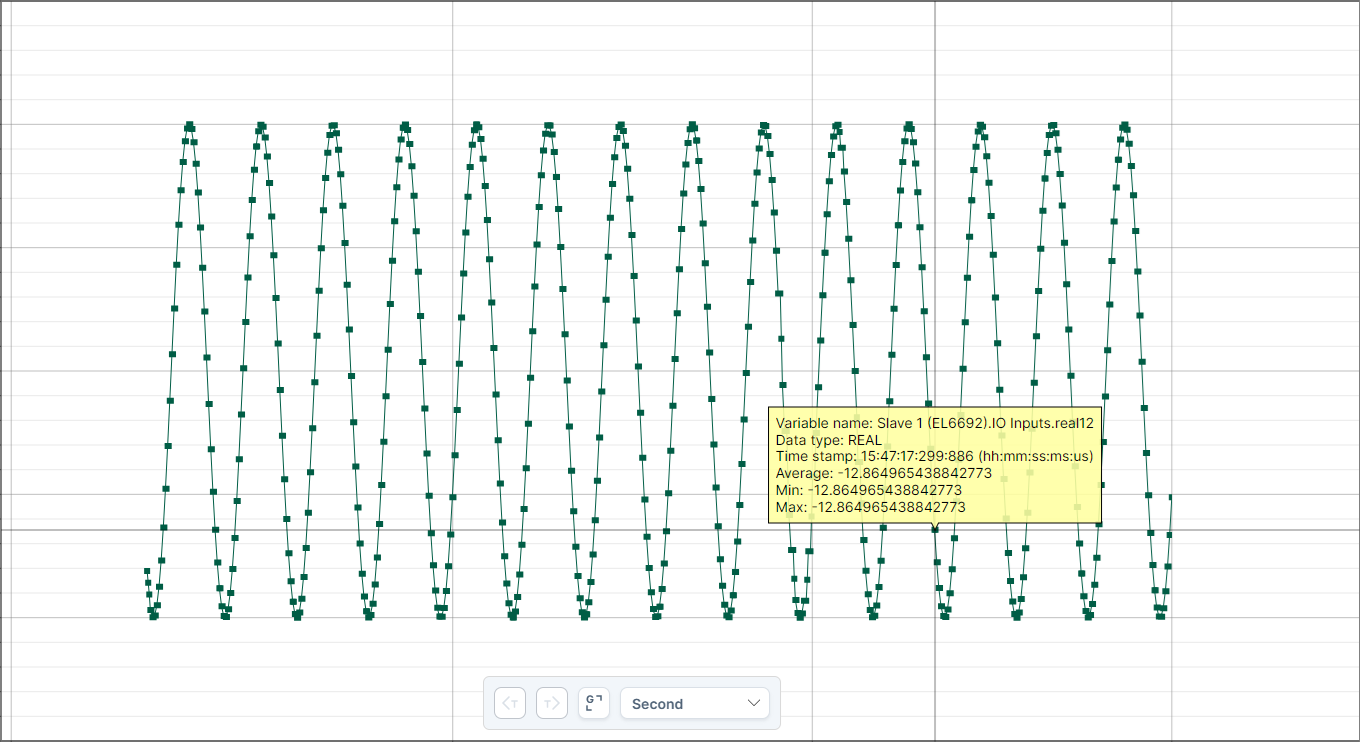
Process data monitoring with real-time charts
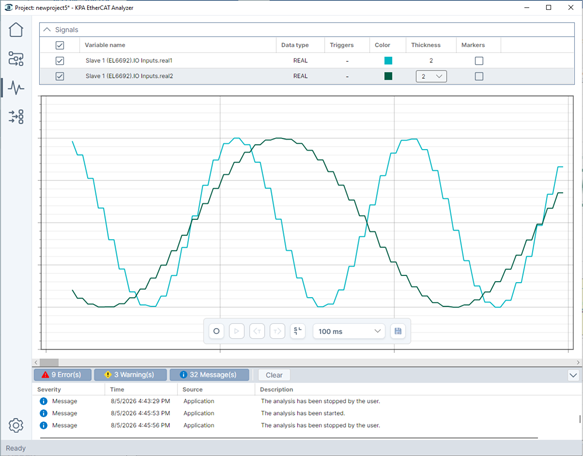
See process variables (inputs/outputs) in an intuitive, graphical view.
- Focus on exactly the signals you care about
- Inspect exact values at any instant
- Watch lists keep important signals in view
Capture the moments that matter – without continuously storing all traffic
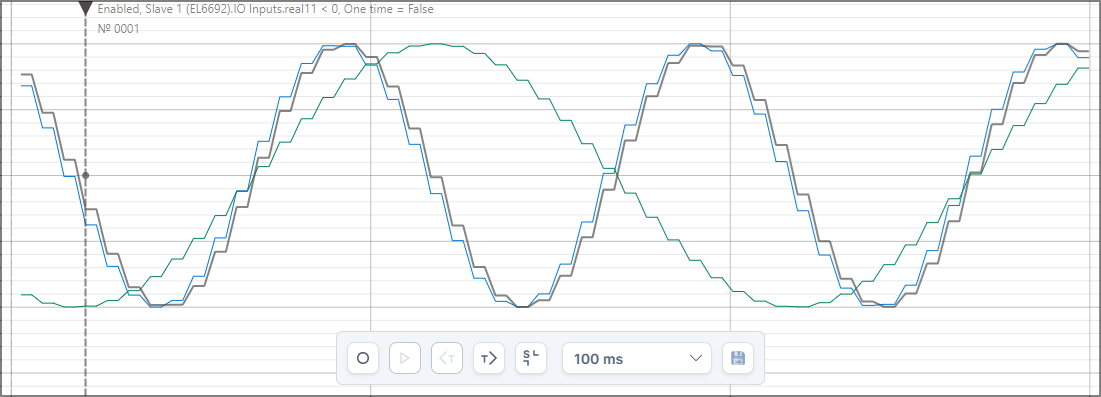
Define signal-based trigger conditions and retain the relevant traffic around the event for subsequent analysis.
Flow: Continuous observation → trigger event → retained pre-/post-trigger window → offline analysis
Trigger conditions:
01
Signal threshold
Start when a value crosses a limit and record a window around it.
start when
Slave1.Signal1.Value > 8.5
record 30s before/after
02
Time-based
Record a window around a specific moment.
record 5s before/after 14:30:00
03
Cross-signal logic
Combine conditions across signals.
capture when
Slave1.IsMotorRunning = true AND
Slave1.Temperature > 50
From traffic analysis to extended system diagnostics
For networks running KPA EtherCAT Master, direct integration provides additional diagnostic information beyond the standard Process Image.
- Working Counter (WKC) statistics
- Port status and communication error counters per slave
- Slave error registers and AL status codes
Architecture and technology
Modular, self-contained
- Currently available for Windows; the architecture allows future builds for additional operating systems.
- Built on Avalonia UI (.NET)
- Uses the standard ENI file to decode process data
- Offline analysis of captured .pcap files
- Live visualization in a graphical interface
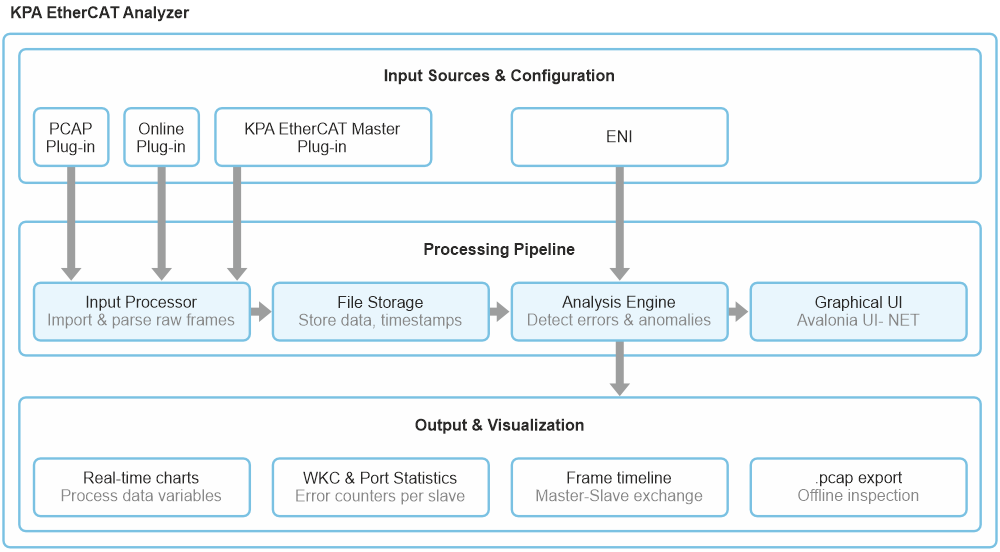
01
Input processor
.pcap imports and live capture; parses raw EtherCAT frames
02
File Storage
Stores parsed EtherCAT data and computed timestamps
03
Analysis engine
Frame decoding, timing evaluation, event detection and diagnostic data processing
04
Graphical UI
Visualization and user interaction
